


Are Girls Getting Tougher, or Are We Tougher on Girls?
by
Meda Chesney-Lind
The National Center for Juvenile Justice finds that although girls still account for less than half of cases nationwide, they make up a growing proportion of delinquency court caseloads (Puzzanchera, Adams, & Sickmund, 2010). The increase for girls is especially apparent for offenses against persons, most of which (69.5%) are simple assaults (Sickmund, 2009). For example, girls’ person-offense case rates (per 1,000 juveniles) increased 13% between 1995 and 2007, while the rate for boys fell 11% (Puzzanchera et al., 2010). Arrest rates appear to at least partially drive the changes in the gender composition of juvenile court caseloads. Specifically, the sharper decline in boys’ as opposed to girls’ arrest rates from 1999 to 2008 has contributed to girls making up a greater proportion of youth arrested for assault (Puzzanchera, 2009).Despite the increasing proportion of girls in arrest and court statistics, girls are not necessarily becoming more like boys in assaultive behavior. As criminologists have recognized for decades (e.g., Biderman & Reiss, 1967), not just illegal behavior but also mechanisms of social control affect official statistics. Addressing alternative explanations of rates of justice system involvement, Steffensmeier, Schwartz, Zhong, and Ackerman (2005; also see Schwartz, Steffensmeier, & Feldmeyer, 2009) contrasted normative and constructionist theoretical explanations of changes in official statistics. Normative theory attributes levels of arrest and court involvement to illegal behavior (e.g., D’Allessio & Stolzenberg, 2003). In contrast, constructionist theory focuses on how justice system decision-makers affect arrest levels and court involvement (e.g., Feld, 2009; Rosenfeld, 2007).
Some scholarship supports the normative explanation that girls either have always been or are becoming more similar to boys in the use of violence (e.g., Graves, 2006). However, two things complicate determining whether girls’ increased proportion of arrests and juvenile court cases is due to their being more assaultive than previously recognized or their becoming more assaultive over time. First, given convincing evidence (Butts & Travis, 2002; Cook & Laub, 2002) that for combined samples of girls and boys, violence has been decreasing since the mid-1990s, the appropriate question is not whether girls are becoming more violent, but whether girls’ violence is decreasing less than boys’ violence. Second, tendencies toward more arrests and juvenile court involvement for the less injurious offenses might cause any increased similarity in girls’ and boys’ arrest rates. Steffensmeier et al. (2005) summarized the literature showing that boys’ violence tends to be more serious than girls’ and more often directed at strangers and committed outside of family and school settings. If reporting to the police and arrest practices change in the direction of bringing more youth into the system for simple (i.e., not aggravated) assaults, then regardless of any stability in youths’ behaviors, girls’ and boys’ arrest rates will look more alike. Feld (2009) supported this contention by comparing boys’ and girls’ ratios of simple to aggravated assault arrest rates.
Between 1980 and 2005, boys’ ratios approximately tripled, while girls’ ratios increased over five times, indicating that with time, police have arrested especially girls for simple rather than aggravated assaults. Unless court personnel counteract the increase with diversion, girls charged with simple assaults will constitute an increasing proportion of juvenile caseloads.To separate out changes in girls’ arrests and behavior, Steffensmeier et al. (2005) carried out trend analyses of (1) youths’ arrest rates for several types of violence, (2) victim reports of the same types of youth violence (except homicide), (3) youths’ self-reports of their own violence, and (4) the gender gaps for each of these three types of indicators. The gender gap is the female percentage of total violence by youth. Steffensmeier et al. (2005) focused on whether this gap is narrowing, which would suggest that girls and boys are becoming more similar in their violence and/or that justice system processing is changing. They used Uniform Crime Report (UCR) data to examine population-based arrest rate trends from 1980 through 2003 for the offenses: aggravated assault, simple assault, a combined measure of both types of assault, and a violent crime index for aggravated assaults, homicide, rape, and robbery. For all UCR measures, although girls’ rates remained consistently lower than boys’ rates, the gap narrowed over time because since the late 1990s the arrest rate decreased faster for boys than for girls. Analysis of trends in rates and the gender gap for the same crimes, but as indicated by the National Crime Victimization Survey (NCVS), the Monitoring the Future survey (MTF), and the National Youth Risk Behavior Survey (NYRBS), did not show the same gender gap narrowing (but see Lauritsen, Heimer, & Lynch, 2009). In fact, NYRBS data showed an increased gender-gap, with girls becoming increasingly less violent than boys.
Steffensmeier et al. (2005) recognized that the data sources they used had limited generalizability. For instance, the MTF and NYRBS studies are school-based samples, and thus did not generalize to school dropouts. However, by demonstrating similar findings across different datasets, Steffensmeier et al. (2005) increased the credibility of their conclusions. Apart from the UCR arrest data, which are the most affected by police policies and practices, all other data sources showed considerable stability, and one even showed an increase in the gender-gap in youth violence. Consistent with a constructionist explanation, policy changes, not changes in girls’ behavior, appeared to be driving a narrowing of the gender gap in arrests.Despite Steffensmeier et al.’s (2005) impressive analysis of gender-gap patterns across multiple indicators of arrest and delinquent behavior, a specific analysis of individual-level data on this subject would add weight to their conclusion. Even if trends in population-based rates and youth-sample-based rates suggest the validity of a constructionist explanation, it does not necessarily follow that police and courts are responding to individual youth more harshly, holding constant the effects of those youths’ assaultive behavior. Confirmation of a change in response at the individual level of analysis would support Steffens-meier et al.’s (2005) inference that girls’ growing proportion of arrests for person offenses is constructed through police policies and practices. The inclusion of an individual-level analysis of court response would provide additional evidence that justice system agents’, not girls’, behavior is contributing to increased similarity in official indicators of girls’ and boys’ delinquency.This article presents research to compare girls’ and boys’ propensities for being on juvenile court caseloads for two years (1980 and 2000), controlling for self-reported assaultive behavior. From 1980 to 2000, female delinquency caseloads grew substantially and at a faster pace than male caseloads (Puzzanchera et al., 2010). The study also considers the effects on the decision to charge youth. It presents differences in the proportions of youth in various demographic groups who had been placed in a correctional institution in 1980 and 2000. However, because no Hispanic girls had a history of correctional institution placement in 1980, a problem known as zero cell count, it was not possible to test a model to predict the probabilities of placement.
Next, we review three policy and practice changes that suggest an increasing harshness in justice system response that disproportionately affects girls and/or minority youths. Consistent with feminist theory (e.g., Burgess-Proctor, 2006; Potter, 2006), gender research must consider intersections with minority status. The intersectional framework explores how gender and other status markers “operate together in people’s lives” (Anderson & Collins, 2001, p. 5) and argues for the importance of using approaches to studying women’s and girls’ lives that attend to power systems and structures of inequalities. The three policy and practice changes described below offer plausible explanations for why girls, especially those who are racial and ethnic minorities, make up a growing proportion of juveniles on court caseloads for assault.As Rosenfeld (2007, p. 264) wrote about his own research, to draw conclusions about policy changes, inference from a study of trends in rates is “circumstantial until the crime recording and classification practices of representative law enforcement [and we would add juvenile court] agencies are directly inspected.” Our research does not provide such direct examination of decision-making and practices. Instead, it determines whether girls and minorities have disproportionately experienced an increase in the probabilities of arrest and juvenile court contact. If they have, it would be important to do additional research to understand why this is the case and to determine the consequences of bringing increasing numbers of some demographic subgroups of youth into the justice system.
The next section reviews research findings that between 1980 and 2000, police, school, and juvenile court delinquency recording and classification policies and practices changed. It also considers a possible result of these changes: girls’ increasing presence in residential placements due to charges for simple assaults. These changes in policies and practices sparked our interest in comparing the harshness of the justice system response to physical assault for the two representative US samples of youth, one taken in 1980 and the other in 2000, and in examining gender and race/ethnicity differences in any changes. The literature on the effects of shifting policies also influenced the decision to focus on girls.
Justice System Policies and Practices That Could Affect Levels of Arrest and Court Supervision
Contemporary scholars have documented (Garland, 2001), and in some cases recommended (Wilson & Kelling, 1982), decreasing justice system tolerance of disruptive, disorderly, and illegal behavior that police and courts previously overlooked or deflected. For example, based on a comparison of UCR and NCVS data trends, Rosenfeld (2007) found that in recent years, less serious assaults (i.e., not gun related) have an increased propensity to result in arrest. For youth assaults, three policy changes are relevant to girls’ and/or racial/ethnic minorities’ entry and penetration into the justice system with assault charges. These policies are embedded in domestic violence laws and implementation practices; juvenile court practices of charging youth who previously would have been charged as status offenders with assault; and zero-tolerance school discipline policies promoting referral of school misbehavior to police.
Domestic Violence Laws and Practices
Prior to the mid-1980s, police usually responded to domestic violence with mediation or separation rather than arrest (Bayley, 1986). Three influences led to new laws to encourage or mandate arrest: successful liability cases for victims injured after police failed to make an arrest; findings from the Minneapolis Domestic Violence Experiment; and related to the experimental findings, a US Attorney General’s 1984 endorsement of arrest as the preferred police response (Sherman, 1992). By 2003, all states permitted warrantless arrest with probable cause for misdemeanor family violence (Miller, 2004). After passage of the laws, research showed arrests in over 30% of all cases (see review by Buzawa & Hotaling, 2006).Domestic violence laws expanded beyond domestic partner violence to include altercations between parents and children, siblings, and other house-hold residents (Buzawa & Hotaling, 2006). Durose et al. (2005) used information on 270,000 domestic violence victimizations included in the 2000 National Incident-Based Reporting System (NIBRS), with detailed information on each incident reported to the police in jurisdictions serving 16% of the population. Approximately one-third of family violence victims were parents, siblings, or other family members. For this one-third of all family violence incidents, youth made up 50.6% of offenders acting against a parent and 31.8% of those acting against siblings. Police took youths’ violence against parents quite seriously, as evidenced by arrests of 50% of children under age 13 suspected of violence against a parent (Durose et al., 2005). Durose et al. (2005) did not determine whether youth arrested for family violence committed aggravated assaults or other particularly serious offenses. However, most NIBRS data family violence incidents (72.7%) were simple assaults, just 12.5% were aggravated assaults, 9.3% were intimidation, and the remaining small proportion included sex offenses (usually by a parent against a child), kidnapping, and homicide.
Additionally, simple assaults accounted for more family violence than non-family violence arrests (77.4% vs. 62.3%). Durose et al.’s (2005) work is highly suggestive that pro-arrest policies for an expanded definition of domestic violence are resulting in increased arrests of youth for simple assaults against family members.Other researchers have drawn similar conclusions (e.g., Acoca, 1999; Acoca & Dedel, 1998; Buzawa & Hotaling, 2006). For example, from analysis of cases in five Massachusetts police jurisdictions, Buzawa and Hotaling (2006) found that, net of other effects (including legal requirements), compared with other family violence calls, the odds of an arrest were significantly increased when a parent called the police about a child perpetrating abuse or assault. Although their five-jurisdiction study has limited generalizability, it is notable that in their findings, 30% of domestic violence cases involved non-domestic partner family members and that such cases often resulted in arrest, essentially replicating the NIBRS findings (Durose et al., 2005). Buzawa and Hotaling (2006) also found that most youths assaulted a parent in response to being assaulted by that parent, and the odds of parental arrest were relatively low when youths were complainants about injury-producing assaults or threats of harm by parents. Finally, for every type of victim–offender relationship (parent–child, intimate partner, sibling), females suspected of acting violently had higher odds of arrest than suspected males. For example, 91.7% of daughter, but 75% of son, assaults on a parent resulted in arrest. Buzawa and Hotaling (2006) speculated that police might be less tolerant of girls’ than boys’ violence.
Charging Up
The 1974 federal Juvenile Justice and Delinquency Prevention Act required that to receive federal funding, states must comply with requirements for responding to status offenders: not holding them in secure detention, keeping them in families and communities rather than juvenile institutions, and separating them from delinquent and adult offenders (Schwartz, 1989 as cited in Feld, 2009). There is considerable evidence (see review by Chesney-Lind & Belknap, 2004) that many juvenile courts circumvented the new legislation by relabeling status offenses as delinquent acts. In an example facilitated by the above described family violence legislation, family conflicts that might have led to status offense charges now result in delinquency charges of assault (Buzawa & Hotaling, 2006). Further documenting the combined effect of domestic violence laws and charging up, a high proportion of girls’ assault charges involve non-serious, mutual combat situations with parents (Acoca, 1999; Belknap, Winter, & Cady, 2001).Relabeling girls’ arguments with parents from status offenses (e.g., “incorrigible”) to assault is a form of “bootstrapping” that has been particularly pronounced for African American girls. At the same time that it undermines ending disproportionate minority confinement, bootstrapping may counteract decades of efforts to deinstitutionalize status offenders by promoting girls’ detention and long-term residential placement (Chesney-Lind, 2010). Girls’ court referrals and commitments to juvenile institutions have been on the rise, and this is particularly true for African American girls. For example, between 1995 and 2005, girls’ detention commitments grew by 48.6% compared to a 7.3% increase for boys, and between 1996 and 2005, girls’ commitments to placement for assault increased by 18.6%, suggesting that much of this is related to the harsher response to girls’ violence (Sickmund, Sladky, & Kang, 2008).
Suggesting the link of arrests and court processing to confinement of youth detained for offenses against the person, girls’ charges were far more likely than boys’ to be in the category “other person, “ which is predominantly simple assaults. Boys were disproportionately charged with more serious offenses, such as aggravated assault, robbery, and murder. Over half (51.8%) of the girls, but less than a third of the boys in detention (31.2%), were held for the less serious forms of violence (Snyder & Sickmund, 2006). In a pattern parallel to that for detention, girls’ commitments to residential facilities also increased by 88% between 1991 and 2003, while boys’ commitments increased by only 23% (Snyder & Sickmund, 2006). Again, simple assault is a more common charge for committed girls than for boys (Snyder & Sickmund, 2006).There also are race-based differences in youth incarceration. For example, although White girls make up 65% of the at-risk population, the American and National Bar Associations (2001) found that half of girls in secure detention were African American. A more recent analysis by the National Council on Crime and Delinquency (2007) showed that African American and Native American girls were held in custody at three times the rate of White girls. African American girls were incarcerated at a rate of 214 per 100,000, Native American girls at a rate of 209 per 100,000, and White girls at the much lower rate of 68 per 100,000.
Schoolhouse to Jailhouse
In 1989, schools increased expulsions and suspensions as part of zero tolerance discipline policies (Browne, 2003; Skiba & Peterson, 1999; Verdugo, 2002). In the 1990s, some forms of federal funding required schools to adopt zero tolerance policies designed to curb drug- or gang-related activity. Like domestic violence laws, the policies expanded to cover a greater range of rule violations. The rationale was that severe punishment of the less serious infractions would prevent serious delinquency (Reynolds et al., 2006). Abandoning past practices of internal handling of much student misbehavior, some schools began to routinely call police to handle student fights, thefts, and robberies or to station police and security guards in schools.Analysis of data on school suspensions and expulsions suggests some gender and racial bias. Although the research does not directly link such discipline to police contact, it suggests that school referrals to police might mirror the same biases. There is greater use of school suspension and expulsion for Black youth (Reynolds et al., 2006). In a nationally representative sample of high school students, although Black boys were modestly (30%) more likely than White boys to be sent to the office or detained after school, they were more than three times more likely to be suspended or expelled (Wallace, Goodkind, Wallace, & Bachman, 2008; also see Losen & Skiba, 2010; Raffaele, Mendez & Knoff, 2003; Skiba, Michael, Nardo, & Peterson, 2002; Skiba & Rausch, 2006). The racial gap is pronounced especially for Hispanic and Native American girls, and even more for Black girls, who were five times more likely than White girls to be suspended or expelled. Wallace et al. (2008) based their conclusions on multivariate analysis that ruled out spuriousness due to family structure, parental education (a proxy for socio-economic status), and region and urbanity. Racial and ethnic groups did not differ in the initial behaviors targeted by zero tolerance policies (i.e., possession or use of alcohol, drugs, or guns in school). The racial/ethnic group differences in response appear to be related to harsher handling of less serious incidents. The disparity began at least since the early 1990s, but when school discipline rates decreased for most other groups after 2000, they continued to increase for Black youth.
More than academic researchers, advocacy groups have collected and analyzed information on the links between school disciplinary practices, school failure, and ultimately incarceration. Especially active, Advancement Project, based in both Washington, DC and Los Angeles, gathered information on several school districts across the country. Working with multiple partners, Advancement Project produced an analysis of national statistics and in-depth examinations of Miami-Dade, Houston, and Palm Beach County schools (Browne, 2003), an analysis of schools in Denver, Palm Beach County, and Chicago (Advancement Project, 2005) and a summary of public hearings in six Florida school districts (Florida State Conference NAACP, Advancement Project, & NAACP Legal Defense and Educational Fund, 2006; also see Gordon, Piana, & Keleher, 2000; Michigan Public Policy Initiative, 2003; Tailor & Detch, 1998). All of the Advancement Project reports point to a schoolhouse to jailhouse track for youth in those school districts. Specifically, schools referred disproportionately minority and disadvantaged youth to police, who arrested and referred them to court, often for offenses that school officials previously handled internally. For example, Browne (2003, p. 25) found that in Palm Beach, prosecutors were “swamped with school-related cases that they believe do not belong in the court system. There have been cases where students were charged with throwing a deadly missile—a coke bottle or an orange—at a school building. Sex charges typically involve a student ‘mooning’ others or pulling up another’s shirt.” Additional research is needed to confirm the scope and extent of movement along the schoolhouse to jailhouse track. Still, the advocacy group-generated evidence indicates the existence of such a track and its disproportionate impact on girls, especially minority girls.
The Present Study
Between 1980 and 2000, there were several legal, policy, or practice changes that could account for girls, especially those in racial/ethnic minority groups, being brought more deeply into the justice system, particularly for assaultive behavior. Though other research documents no increase in youths’ assaultiveness in this period, we do consider whether any change accounts for justice system responses. There are two reasons for the focus on assaultive behavior:(1) most policy and practice changes that led to the expectation that the system became “tougher” between 1980 and 2000 pertained to assault; and (2) assaults are typically seen as more dangerous and serious than other offenses, and thus would drive the severity of response. For gender and racial/ethnic subgroups, we compare the probability of juvenile court supervision for assaults in 1980 and 2000 controlling for self-reported assaultive behavior. We also compare the probabilities of being charged for the subgroups and consider whether this earlier decision affects the probability of juvenile court supervision; and for each gender and race subgroup, we document differences in the proportion of youth in a residential facility in 1980 and 2000.
Data and Methods
Data used in this study come from two sources: the 1980 wave of the National Longitudinal Survey of Youth 1979 (NLSY79) and the 2000 wave of the National Longitudinal Survey of Youth 1997 (NLSY97). The NLSY79 and NLSY97 are nationally representative surveys of the US population born from 1957 to 1964 and 1980 to 1984, respectively. These datasets allow for the comparison of delinquency and juvenile justice processing outcomes for two nationally representative youth cohorts. The initial cohorts were selected by standard area-probability sampling methods. Respondents have been surveyed annually beginning in 1979 for the NLSY79 and 1997 for the NLSY97. The initial wave of the 1979 sample included 12,686 youth aged 14–22 years, and the 1997 sample included 8,984 youth aged 12–16 years. Retention rates for the NLSY79 1980 and the NLSY97 2000 were relatively high. The 1980 round of the NLSY79 included 12,141 youth (95.7% of the original sample), and the 2000 round of the NLSY97 included 8,080 youth (89.9% of the original sample). Both surveys over-sampled Black and Hispanic youth to increase the reliability of statistical analysis for these groups and included sampling weights to account for probability of selection into the original sample, non-random attrition, and to remove bias due to over-sampling.
For the NLSY79 cohort, youths were only asked about their delinquent behavior and criminal justice contact during the 1980 wave of data collection. We selected the NLSY97 2000 wave comparison group because it was the year in which the youths’ ages most closely resembled those of the 1980 youth. To determine whether there are differences between 1980 and 2000 in youths’ likelihood of having been convicted of assault, we excluded youth over 18 years of age from the analyses. In the majority of states, youth 17 and under are under the jurisdiction of the juvenile court (Sickmund, 2003), so it seemed appropriate to use the age of 18, since the survey elicited information about the prior years’ experiences. Thus, youths included in the present analysis were between ages 15 and 18.
Measures
The NLSY surveys refer to a court finding that a youth committed an assault as a conviction for assault. Youth self-reported whether they had ever been convicted for an assault in 1980, and the youth interviewed in 2000 self-reported conviction for assault each year from 1997 through 2000. We derived a dichotomous (0 = never reported and 1 = reported at least once) indicator of conviction from the available data.An increased probability of being charged with an offense could explain any change in the probability of conviction. (In the NLSY the youth are asked whether they had been charged with a crime by the police or anyone at the courts.) Thus, we carried out a separate analysis of the probability of being charged, and we examined the probability of conviction for assault with a correction for the probability of being charged. Being charged was a dichotomous variable coded as 1 if youths self-reported ever being charged for breaking a law other than a minor traffic offense, and 0 if they did not.
In both 1980 and 2000, youths self-reported attacks on other people, but the questions qualified the nature of attacks differently in the two periods. In 1980, youth reported the number of times they attacked another person with the idea of seriously hurting or killing them. In 2000, they reported the number of times they attacked someone to hurt or fight with them. The 1980 question might suggest to youth that they should report only the most serious attacks, and therefore it might underestimate attacks that youth might have reported in response to the 2000 question. This would mean that an observed decrease, as we report below, might have been larger if youth had been restricted to the more serious assaults described in the 1980 interviews.We used self-reported attacks in 1980 for the NLSY79 cohort and self-reported attacks in 2000 for the NLSY97 cohort as indicators of a general tendency to engage in assaultive behavior in adolescence. The rationale for the reference period was that delinquency in one year is a strong correlate of delinquency in another (Herrenkohl et al., 2000; Kosterman, Graham, Hawkins, Catalano, & Herrenkohl, 2001; Park, Morash, & Stevens, 2010). For 1980, possible responses to the question about attacking others in the last 12 months were 0, 1, 2, 3–5, 6– 10, 11–50, and more than 50 assaults. For 2000, respondents listed the actual number of times, which we collapsed into ranges to match those of NLSY79. Ranges were coded as their midpoint values, and the variable was censored at 11 or more assaults and treated as approximately continuous.Measurement of the remaining variables was quite straightforward. Year of interview was a dichotomous variable coded as 1 = 2000 and 0 = 1980. Gender was coded as 1 = female and 0 = male. Race/ethnicity was dummy-coded as Black, Hispanic, and non-Black/non-Hispanic (the omitted category).
Statistical AnalysesBecause the NLSY samples of adolescents over-represented racial minority and Hispanic youth, all analyses were conducted with weighted data with the software STATA, which generates accurate parameter estimates, standard errors, and tests of significance for complex survey designs. Bivariate comparisons between continuous and dichotomous predictors were conducted respectively with independent samples t-tests and the design-based F test, which is a modification of the Pearson’s chi-square that accounts for the survey design (Rao & Scott, 1984).
The literature review suggested that due to policy rather than behavior changes, between 1980 and 2000, especially female and racial/ethnic minority youth would have an increased probability of convictions for assaults (i.e., they would have increased probability of being on court caseloads). We first used bivariate analysis to examine differences in demographic characteristics, self-reports of attacking others, and juvenile justice outcomes for youth in 1980 and 2000. Next, we examined the bivariate comparisons of years for girls and boys separately. Then, for multivariate analyses, we fitted binary probit models to estimate the effects of predictor variables on conviction for assault and then on being charged. As noted above, it was not possible to examine the influences of survey cohort and demographic characteristics on likelihood of being placed in a correctional institution because no Hispanic girls reported that they had been placed in either an adult or a juvenile correctional facility in 1980.To estimate differences in the likelihood of having been convicted of assault, for girls and boys separately, we regressed self-reported assault conviction on survey cohort (i.e., interviewed in 1980 or 2000), race/ethnicity, and assaultive behavior. We examined interaction effects to test whether the effect of survey cohort depended on youths’ racial/ethnic group or amount of assaultive behavior. Because youth can only be convicted of assault if they have been charged with a crime, and self-reported assault conviction is unobserved in cases where youth have not been charged with a crime, we examined the possibility of sample selection biases using probit with sample selection modeling (for more information, see Breen, 1996; DeMaris, 2004). Rho, the correlation between the error terms in the sample selection and estimation equations, was statistically significant only for boys, reflecting the presence of sample selection bias.
Therefore, we employed binary probit regression for girls and probit regression with sample selection for boys, which adjusts for non-random selection into the sample in which conviction status is observed and corrects for the inconsistencies and biases that result from only modeling conviction status for those who have been arrested (Breen, 1996).1The literature also suggested that policy changes may increase the probability of arrest in 2000. Therefore, to estimate differences in the likelihood of having been charged with a crime in the first place, for boys and girls separately, we regressed self-reports of a charge on survey cohort, race/ethnicity, age, and attacking behavior. Interaction effects were also examined to test whether the effect of survey cohort depended on racial/ethnic group or self-reported attacks.
Results
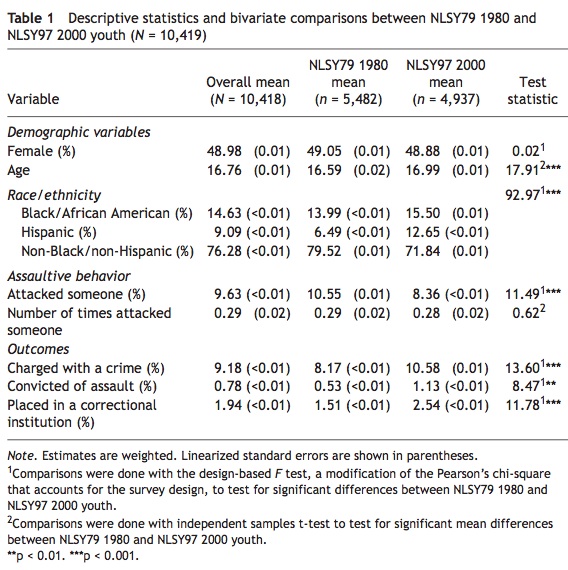
Table 1 presents the means for all variables included in the analyses. Looking at the first column in Table 1, a little less than half of the respondents to the NLSY were females, and youth were, on average, 17 years of age at the time of their interview. A little less than one in six youth was Black or African American, and approximately 1 in 10 was Hispanic. The remaining respondents (approximately three-quarters) were non-Black and non-Hispanic. The vast majority of youth (90.37%) had not attacked anyone since the date of the previous interview. Thus, the average number of attacks committed by the youth during the one-year reference period was extremely low. Less than 10% of youth reported that they had ever been charged with a crime before the 1980 or 2000 interview. Approximately 8% of youth charged with a crime had been convicted of assault. Of youth reporting assault conviction, more than half had been placed in either a juvenile or an adult correctional institution.
Looking at the second and third columns of Table 1, there were several significant differences between the 1980 and 2000 cohorts. Although youth in both groups were, on average, approximately 17 years old, those interviewed in 2000 were slightly older than those interviewed in 1980. Significantly greater proportions of youth interviewed in 2000 were Black or African American and Hispanic. This racial and ethnic group difference is consistent with US the Census population estimates, which document a growth in the proportion of the population who are Black and Hispanic (US Census Bureau, 1996, 2004). In addition, a smaller proportion of youth in 2000 reported attacking someone in the year since the previous interview, and there were no significant differences in frequencies of attacks. Yet, the 2000 youth were more likely to report that they had been charged by the police in their lifetime, convicted of assault, and placed in a correctional institution. Although youth in 2000 were only slightly more likely than those in 1980 to report that they had been charged with a crime in their lifetime (11% compared to 8%, respectively), they were more than twice as likely to have been convicted of assault (1.13% compared to 0.53%, respectively). In addition, they were more than one and a half times more likely than those in the 1980 survey to report that they had been placed in a correc- tional institution (2.54% vs. 1.51%, respectively).
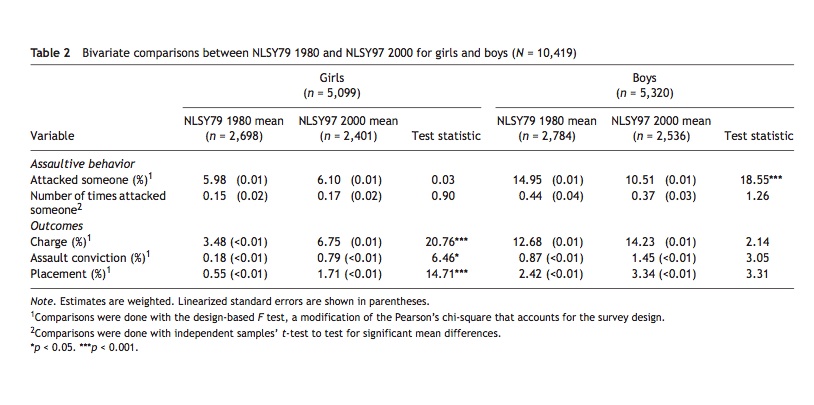
Table 2 presents results of the bivariate analyses comparing 1980 and 2000 girls and boys separately. Lending validity to the self-report data on attacks in 1980 and 2000 and consistent with the literature (Brener, Simon, Krug, & Lowry, 1999; Chesney-Lind & Belknap, 2004; Goodkind, Wallace, Shook, Bachman, & O’Malley, 2009; Lauritsen et al., 2009; Lynch, 2002; Steffensmeier et al., 2005), girls’ reports did not change from 1980 to 2000, but boys reported a decrease in 2000.Germane to our central focus, there was a unique increase in justice system involvement for girls. The 2000 girls were approximately twice as likely to report that they had been charged with a crime in their lifetime (6.75% vs. 3.48%, respectively). Girls in 2000 were also more than four times more likely than those 1980 to report that they had been convicted of assault (0.79% vs. 0.18%, respectively) and more than three times more likely to report that they had been placed in a correctional institution (1.71% vs. 0.55%, respectively). Boys did not experience a similar increase in the proportion charged with a crime, convicted of assault, or placed in a correctional institution in their lifetime.
Analysis of Likelihood of Assault Conviction
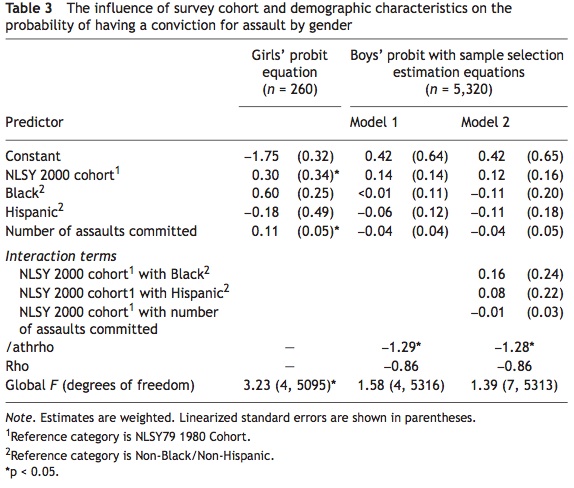
Table 3 presents the probit estimates for the regression of self-reported assault conviction for all youth. For each gender group, we began with a model regressing self-reported assault conviction on survey cohort, racial/ethnic group, and assaultive behavior (Model 1). For boys, we added the cross-products of racial/ ethnic group with survey cohort to test whether race and ethnicity moderate the effect of survey cohort (Model 2). However, we were unable to test for interaction effects in the model for girls due to a zero-cell count problem, resulting because no 1980 Black girls reported a conviction for assault.
For girls, both racial/ethnic group and self-reported attacks were significant predictors of conviction for assault. Regardless of their interview year, Black girls were more likely than non-Black and non-Hispanic girls to have an assault conviction. Girls’ likelihood of an assault conviction also increased as their self- reported attacks increased. For boys, after controlling for selection into the subsample of respondents charged with a crime, the variables—survey cohort, racial/ethnic group, and self-reports of attacks—had no significant effect on likelihood of a conviction for assault. This finding suggests that the increased probability of conviction for assault in 2000, shown by bivariate analysis, may result from an increased probability of being charged with a crime. Thus, we further explored the probability of being charged.'
Analysis of Likelihood of Having Been Charged With a Crime
To determine whether girls’ experiences with the justice system were unique, we estimated separate probit equations for gender groups (Table 4). For each group, we began with a model regressing self-reports of being charged with a crime on survey cohort, racial/ethnic group, and self-reported attacks (Model 1). In Model 2, we added the cross-products of race and ethnicity and reported attacks on others with survey cohort to examine whether the effect of passage of time (2000 vs. 1980) depends on race, ethnicity, or self-reported attacks.
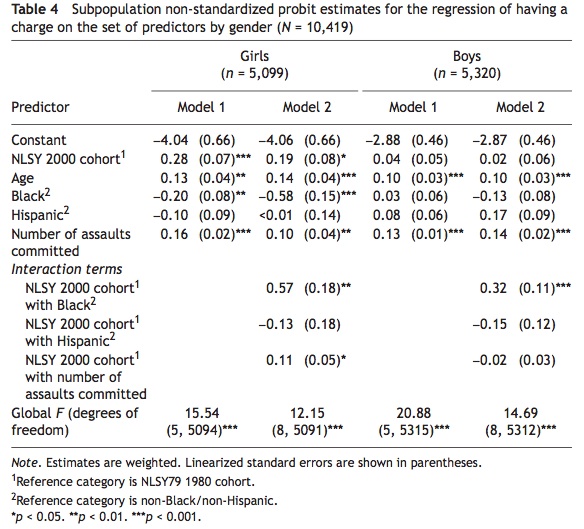
Overall, Table 4 shows that the factors that influence the likelihood of having a charge differ substantially for gender groups. For girls, in Model 1, survey cohort, age, racial/ethnic group, and attacking behavior were all significant predictors of having been charged with a crime. However, the significant inter- action terms in Model 2 for girls indicate that the effects of survey cohort depend on race/ethnicity and attacking behavior. Although girls were more likely to be charged with a crime in 2000 than in 1980 regardless of their racial/ ethnic group, the increase in toughness by the criminal justice system was disproportionately strong for Black girls and for girls reporting multiple attacks. In particular, Black girls in 2000 were much more likely than 1980 Black girls to have been charged with a crime, regardless of their self-reported attacking behavior. Also, the effect of race changes in the two periods. In 1980 Black girls were significantly less likely than non-Black and non-Hispanic girls to have been charged with a crime (Model 2). This avoidance of being charged is gone by 2000, when Black girls are equally likely as non-Black and non-Hispanic girls to be charged. As the number of self-reported attacks increased, the effect of being in the 2000 group increased. At low levels of attacking behavior, 2000 girls were only slightly more likely than 1980 girls to report that they has been convicted of a crime. However, at high levels of attacks, girls in 2000 were much more likely than those in 1980 to have a conviction.
For boys, only age and self-reported attacks had a positive impact on their likelihood of having been charged with a crime (Model 1). Different from the girls, for boys there is no evidence to suggest that being Hispanic and non- Black/non-Hispanic increased the likelihood of being charged with a crime between 1980 and 2000. As for girls, however, the criminal justice response to young Black men was tougher in 2000 than in 1980, as evidenced by their increased likelihood of having a criminal charge, regardless of self-reported attacking behavior (Model 2).
Predicted Probabilities of Having Been Charged With a Crime
To further illustrate these findings, we explored the relative impact of gender, survey year, racial/ethnic group, and assaultive behavior on youths’ probabilities of being charged with a crime. To do this, we calculated estimated predicted probabilities of having a charge by substituting the estimated probit coefficients (β) in Table 4 and individual characteristics (xi) into the following equation:
Pr(Charge=1)=Φ(Σβ X ) k ik
where Φ is the standard normal cumulative distribution function and βk is the estimated coefficient for xk. We calculated the predicted probabilities using the sample mean value of age (16.8 years). Calculating the probabilities for Black, Hispanic, and non-Black/non-Hispanic girls and boys of various levels of assault- ive behavior makes it possible to determine differences in the probabilities of having been charged with a crime across survey cohorts. The outcomes of this analysis are presented in Figures 1 and 2.
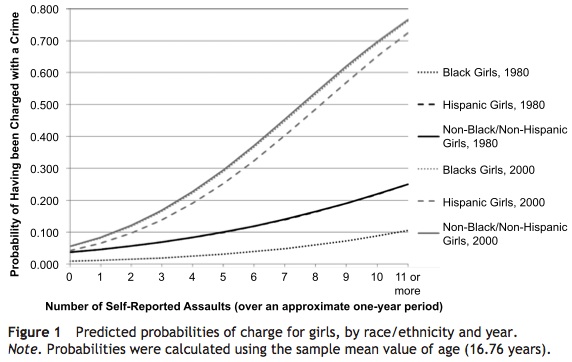
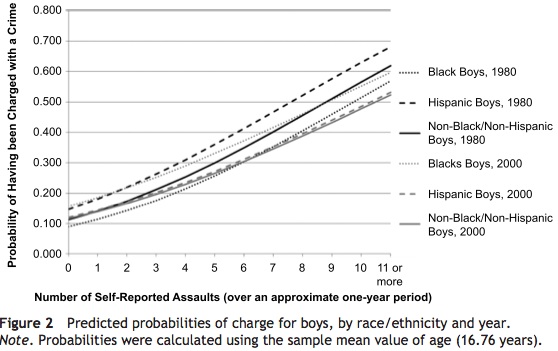
Figure 1 graphs the probability of a charge for girls reporting from 0 through11 or more attacks in the prior year separately for 1980 and 2000 as well as for those who are Black, Hispanic, and non-Black/non-Hispanic. Regardless of racial/ethnic group, girls in 1980 had a lower probability of having been charged with a crime regardless of self-reported attacks. This is shown by the 2000 lines, drawn in grey, being higher than the 1980 lines, drawn in black. In 1980, Black girls (represented by a black dotted line) had the lowest probability of a charge; Hispanic (black dashes) and non-Black/non-Hispanic (black line) girls were almost the same as each other, but still had lower probabilities of charges than girls surveyed in 2000. As 2000 girls self-reported more attacks, their likelihood of being charged with a crime increased sharply. This differs for 1980 girls, whose probability of a charge was relatively low regardless of number of attacks. For example, at high levels of attacking behavior, girls in 1980 had about a one-in-four chance of having been charged with a crime, compared to girls in 2000, who had about a three-in-four chance. Furthermore, Black girls in 2000 were nearly seven times more likely as their 1980 counterparts to have been charged with a crime (0.76 vs. 0.11, respectively).
Figure 2 graphs the probabilities of a charge for boys. The pattern for boys differed from that for girls. Black boys in 2000 (represented by a grey dotted line) were significantly more likely than Black boys in 1980 (black dotted line) to have been charged with a crime, regardless of self-reported attacking behavior. In fact, at very low levels of self-reported attacks, 2000 Black boys were the most likely group, and 1980 Black boys were the least likely group to have a criminal charge. Other racial/ethnic differences from 1980 to 2000 were not significant. As such, regardless of self-reported attacks, Hispanic and non- Black/non-Hispanic boys in 2000 were nearly identically likely as their 1980 counterparts to have been charged with a crime, and in some cases, those in 2000 were less likely than those in 1980 to have been charged with a crime. For example, different from the findings for girls, the probability of having been charged with a crime for non-Black and non-Hispanic boys who reported committing five attacks was nearly the same in the two periods (0.30 in 1980 vs. 0.27 in 2000).
Summary and Discussion
Although youths’ self-reports of attacks on other people did not increase between 1980 and 2000, an increased proportion of youth penetrated into the juvenile justice system in 2000. Bivariate analysis showed that girls in 2000 were nearly twice as likely as girls in 1980 to report they had been charged with a crime. Once charged, however, they had similar conviction and placement rates in the two time periods. The girls’ pattern is unique from that for boys, who were equally likely to report being charged with a crime in 1980 and 2000. Among boys, only those who were Black were significantly more likely to have a charge in 2000. Additionally, the intensifying effect of multiple self-reported attacks on justice system involvement was not as pronounced for boys as it was for girls. Our findings coincide with juvenile court statistics showing greater increases in girls’ than boys’ juvenile court cases since 1980 (Puzzanchera et al., 2010).
The multivariate analyses revealed the effects of gender in combination with race and Hispanic ethnicity. For assault conviction, we found no evidence to suggest that youth in any gender or racial/ethnic group were more likely to be convicted of assault in 2000 compared to their 1980 counterparts. When being charged with any crime was the dependent variable, however, we found that regardless of racial/ethnic group, the girls in 2000 were much more likely than those in 1980 to have a charge. The increase in justice system involvement was magnified for Black girls. Also, girls’ increased justice system involvement was pronounced especially for girls who self-reported multiple instances of attack- ing others. It may be that when girls are more violent, tolerance for their behavior decreases exponentially. This explanation agrees with earlier research showing that as girls and women significantly violate gender norms, the punish- ment can sometimes be very harsh (Bernstein, Cardascia, & Rose, 1979; Chesney-Lind & Eliason, 2006).
Comparisons across gender and racial groups may be affected by demo- graphic differences in the validity of self-report measures of illegal activity, arrests, and convictions. Two early studies (e.g., Hindelang, Hirschi, & Weis, 1981; Huizinga & Elliott, 1986) found that Black males were less likely than other youths to self-report delinquent acts. A more recent study (Jolliffe et al., 2003), however, revealed the opposite, that compared to other youth, Black males were most accurate in reporting offenses that resulted in court referrals. Moreover, except for Asian females, Jolliffe et al. (2003) found that the proba- bility of a youth with court contact reporting a corresponding offense was quite high, that is, at least 90%; thus, most groups of youth reported the vast majority of their known offenses. Based on an assessment of a multi-item scale used with adolescents recruited beginning in 2000, Knight, Little, Losoya, and Mulvey (2004) concluded that the delinquency self-report measure had functional equivalence (i.e., it was related as expected to other variables) across multiple demographic subgroups. Relevant to our research, Park et al. (2010) showed that for girls and boys, the relationship of the NLSY97 self-reported attack measure to other variables was consistent with theory, and thus had functional equivalence. However, based on additional analysis of the self-report items used in their own research, Knight et al. (2004) cautioned about the use of the scale to compare means across groups. Despite inconsistent findings in above- cited and other studies (e.g., Farrington, Loeber, Stouthamer-Loeber, van Kammen, & Schmidt, 1996; Hirschi, 1969; Maxfield, Weller, & Widom, 2000), we agree that caution is warranted in comparing results across groups.
We considered whether our interpretation of findings could be compromised by girls, but not boys, becoming more likely to admit to attacking others or justice system involvement due to changes in normative expectations for girls between 1980 and 2000. For two reasons, we believe this is not the case. First, self-report data collected in the 1970s and 1980s revealed girls’ higher involve- ment in assaultive behavior than official statistics showed (e.g., Canter, 1982; Elliott & Voss, 1974); girls have self-reported some level of person offenses for decades. Second, if girls were becoming much more likely to report their delin- quency over time, we would have found higher levels of reporting in 2000 than in 1980. Our analysis of NLSY data and Steffensmeir et al.’s (2005) analysis of school survey data showed girls reporting the same or lower levels of assaultive behavior over time.
Recall that the youth interviewed in 1980 were asked only once about prior convictions for assault and prior charges; the youth interviewed in 2000 were asked about conviction and arrest in each year from 1997 to 2000. We used all of the available data to develop dichotomous variables reflecting whether or not there were convictions for assault and whether or not there were prior charges. It is possible that the youth in the 2000 group reported more convic- tions and arrests because they had more opportunities to report. If this were the case, we would expect any difference between 1980 and in 2000 to be specific to the NLSY samples. However, researchers have shown that differences between 1980 and 2000 are found using other datasets. Specifically, using a very different data source, Puzzanchera, Stahl, Finnegan, Tierney, and Snyder (2004) documented that between 1985 and 2000, the rate of youth on court caseloads for offenses against persons (with the youth population size as the denominator) increased by 78%.
While the NLSY data include specific information available on self-reported attacks against persons and on convictions for assault, the charge data is for all types of offenses. This is appropriate for the sample selection model to predict convictions for assault. In the multivariate model to predict charges, the reali- ties of what data were collected restricted us to using charges for any sort of offense rather than charges specific to assault. The literature review of policy changes at the beginning of this article does suggest that there would be increased assault charges between 1980 and 2000. Our findings are consistent with this expectation, but they are not specific to charges for assaults.
Note also that the binary measure of assault conviction does not capture multiple convictions. It is possible that the justice system has also become increasingly harsh on boys in that boys in 2000 may be more likely than those in 1980 to have received multiple convictions for assault. Although the NLSY data did not include a measure of the number of times youth had been convicted for assault, it did include information on the number of times youth had been convicted for any offense. Using the indicator of the number of convictions for any offense, we found no evidence that boys in 2000 received more convictions than those in 1980. Girls in 2000, however, reported more than twice as many convictions than those in 1980. Thus, we have no reason to suspect that our binary measure of assault conviction underestimated convictions more for males than for females.
It is not possible to directly connect the reviewed policy changes to increased probabilities of either conviction or being charged. What is very clear, however, is that consistent with much prior research, the justice system is getting tougher on girls but girls do not appear to be getting tougher. The trends shown by comparison of 1980 with 2000 data have not reversed since 2000. Recent figures show that juvenile female arrests for simple assault increased 12% between 1999 and 2008 (Puzzanchera, 2009). Arrests fuel the growth in numbers of girls on juvenile court caseloads.
There seems to be an increased willingness on the part of all authorities to both police and punish youth violence, particularly if those exhibiting the behavior are females and especially if they are African American. It may be that the systems of social control have shifted from policing girls’ sexuality, as was the case for most of the last century (see Odem, 1995), to instead policing girls’ violence, and most particularly the violence of young African American girls. A promising initiative to promote police understanding of adolescent girls and thereby to encourage their use of alternatives to arrest is the Office of Juvenile Justice and Delinquency Prevention-sponsored International Association of Chiefs of Police training initiative to alert police to girls’ frequent dual status as victim and alleged offender (Office of Juvenile Justice and Delinquency Preven- tion, 2009). For girls who are arrested, juvenile courts and other community stakeholders would benefit from developing a coordinated response that includes self-study of forces that may drive harsh responses to girls (and minor- ity groups) and the development of checks, balances, and alternatives that promote positive outcomes for girls.
There is a need for three types of expanded research. First, research needs to establish the magnitude and the nature of the connection of youth arrest rates for assaults differing in seriousness to the various relevant policies as imple- mented in different jurisdictions. This might be done through qualitative case studies across multiple sites. Second, there is a need for additional research on the impact of school-based zero tolerance initiatives, particularly in schools attended by large numbers of African Americans, and the impact of mandatory arrests on the criminalization of youth, particularly girls, to determine if age- and gender-based discrimination are occurring in police decisions to arrest. Third, research should carefully document the effects of bringing especially girls and minorities into the justice system. Although there is increasing evidence of girls’ growing probabilities of arrest and conviction, the literature falls short in qualitative and quantitative demonstrations of the outcomes of girls’ experi- ences in the justice system. Evidence of the shortcomings of existing justice system programs raises concerns about negative results for girls. Moving girls deeper into the justice system can have clear and racialized negative conse- quences. Research on girls’ actual histories as they move deeply in to the justice system is crucial for informing policy recommendations regarding the trend to increase especially girls’ and minority youths’ involvement.
Notes
References
Acoca, L. (1999). Investing in girls: A 21st century strategy. Juvenile Justice, 6(1), 3–13.
Acoca, L., & Dedel, K. (1998). No place to hide: Understanding and meeting the needs of girls in the juvenile justice system. San Francisco: National Council on Crime and Delinquency.
Advancement Project. (2005). Education lockdown: The schoolhouse to jailhouse track. Washington, DC: Author.
American Bar Association, & National Bar Association. (2001). Justice by gender: The lack of appropriate prevention, diversion and treatment alternatives for girls in the justice system. Washington, DC: Author.
Anderson, M. L., & Collins, P. H. (2001). Race, class, and gender: An anthology (4th ed.). Belmont, CA: Wadsworth.
Bayley, D. H. (1986). The tactical choices of police patrol officers. Journal of Criminal Justice, 14, 329–348.
Belknap, J., Winter, E., & Cady, B. (2001). Assessing the needs of committed delinquent and pre-adjudicated girls in Colorado: A focus group study. Denver, CO: Colorado Division of Youth Corrections.
Bernstein, I. N., Cardascia, J., & Rose, C. E. (1979). Defendants, sex, and criminal court decisions. In R. Alvarez & K. G. Lutterman (Eds.), Discrimination in organizations (pp. 320–354). San Francisco: Jossey-Bass.
Biderman, A. D., & Reiss, A. J. (1967). On exploring the “dark figure” of crime. The ANNALS of the American Academy of Political and Social Science, 374, 1–15.
Breen, R. (1996). Regression models: Censored, sample selected, or truncated data. Thousand Oaks, CA: Sage.
Brener, N. D., Simon, T. R., Krug, E. G., & Lowry, R. (1999). Recent trends in violence-related behaviors among high school students in the United States. Journal of the American Medical Association, 282, 330–446.
Browne, J. A. (2003). Derailed! The schoolhouse to jailhouse track. Washington, DC: Advancement Project.
Burgess-Proctor, A. (2006). Intersections of race, class, gender, and crime: Future directions for feminist criminology. Feminist Criminology, 1, 27–47.
Bushway, S., Johnson, B. D., & Slocum, L. A. (2007). Is the magic still there? The use of the Heckman two-step correction for selection bias in criminology. Journal of Quantitative Criminology, 23, 151–178.
Butts, J., & Travis, J. (2002). The rise and fall of youth violence: 1980–2000. Washington, DC: The Urban Institute.
Buzawa, E. S., & Hotaling, G. T. (2006). The impact of relationship status, gender, and minor status in the police response to domestic assaults. Victims & Offenders, 1, 323–360.
Canter, R. J. (1982). Sex differences in self-reported delinquency. Criminology, 20, 373–393.
Chesney-Lind, M. (2010). Jailing “bad” girls. In M. Chesney-Lind & N. Jones (Eds.), Fighting for girls: Critical perspectives on gender and violence (pp. 57–79). Albany, NY: SUNY Press.
Chesney-Lind, M., & Belknap, J. (2004). Trends in delinquent girls’ aggression and violent behavior: A review of the evidence. In M. Putallaz & K. L. Bierman (Eds.), Aggression, antisocial behavior, and violence among girls: A developmental perspective (pp. 203– 220). New York: Guilford Press.
Chesney-Lind, M., & Eliason, M. (2006). From invisible to incorrigible: The demonization of marginalized women and girls. Crime, Media, and Culture, 2, 29–48.
Cook, P. J., & Laub, J. H. (2002). After the epidemic: Recent trends in youth violence in the United States. Crime and Justice: A Review of Research, 29, 1–37.
D’Alessio, S. J., & Stolzenberg, L. (2003). Race and the probability of arrest. Social Forces, 81, 1381–1397.
DeMaris, A. (2004). Regression with social data: Modeling continuous and limited response variables. Hoboken, NJ: John Wiley.
Durose, M. R., Harlow, C. W., Langan, P. A., Motivans, M., Rantala, R. R., & Smith, E. L. (2005). Family violence statistics: Including statistics on strangers and acquaintances. Washington, DC: US Department of Justice.
Elliott, D. S., & Voss, H. L. (1974). Delinquency and dropout. Lexington, MA: Lexington Books.
Farrington, D. P., Loeber, R., Stouthamer-Loeber, M., van Kammen, W. B., & Schmidt, L. (1996). Self-reported delinquency and a combined delinquency seriousness scale based on boys, mothers, and teachers: Concurrent and predictive validity for African-Americans and Caucasians. Criminology, 34, 501–525.
Feld, B. C. (2009). Violent girls or relabeled status offenders? An alternative interpreta-tion of the data. Crime & Delinquency, 55, 241–265.Florida State Conference NAACP, Advancement Project, & NAACP Legal Defense and Educational Fund. (2006). Arresting development: Addressing the school discipline crisis in Florida. Washington, DC: Author.
Garland, D. (2001). The culture of control: Crime and social order in contemporary society. Chicago, IL: University of Chicago Press.
Goodkind, S., Wallace, J. M., Shook, J. J., Bachman, J., & O’Malley, P. (2009). Are girls really becoming more delinquent? Testing the gender convergence hypothesis by race and ethnicity, 1976–2005. Children and Youth Services Review, 31, 885–895.
Gordon, R., Piana, L. D., & Keleher, T. (2000). Facing the consequences: An examina-tion of racial discrimination in US public schools. Oakland, CA: Applied Research Center.
Graves, K. N. (2006). Not always sugar and spice: Expanding theoretical and func-tional explanations for why females aggress. Aggression and Violent Behavior, 12, 131–140.
Herrenkohl, T. I., Maguin, E., Hill, K. G., Hawkins, J. D., Abbott, R. D., & Catalano, R. F. (2000). Developmental risk factors for youth violence. Journal of Adolescent Health, 26, 176–186.
Hindelang, M. J., Hirschi, T., & Weis, J. G. (1981). Measuring delinquency. Thousand Oaks, CA: Sage.
Hirschi, T. (1969). Causes of delinquency. Berkeley, CA: University of California Press.Huizinga, D., & Elliott, D. S. (1986). Reassessing the reliability and validity of self-report delinquency measures. Journal of Quantitative Criminology, 2, 293–327.
Jolliffe, D., Farrington, D. P., Hawkins, J. D., Catalano, R. F., Hill, K. G., & Kosterman,R. (2003). Predictive, concurrent, prospective, and retrospective validity of self-reported delinquency. Criminal Behaviour and Mental Health, 13, 179–197.
Knight, G. P., Little, M., Losoya, S. H., & Mulvey, E. P. (2004). The self-report of offending among serious juvenile offenders: Cross-gender, cross-ethnic/race measurement equivalence. Youth Violence and Juvenile Justice, 2, 273–295.
Kosterman, R., Graham, J. W., Hawkins, J. D., Catalano, R. F., & Herrenkohl, T. I. (2001). Childhood risk factors for persistence of violence in the transition to adulthood: A social development perspective. Violence and Victims, 16, 355–369.
Lauritsen, J. L., Heimer, K., & Lynch, J. P. (2009). Trends in the gender gap in violent offending: New evidence from The National Crime Victimization Survey. Criminology, 47, 361–399.
Losen, D. J., & Skiba, R. J. (2010). Suspended education: Urban middle schools in crisis. Montgomery, AL: Southern Poverty Law Center.
Lynch, J. P. (2002). Trends in juvenile violent offending: An analysis of victim survey data. Washington, DC: US Department of Justice, Office of Justice Programs, Office of Juvenile Justice and Delinquency Prevention.
Maxfield, M. G., Weller, B. L., & Widom, C. S. (2000). Comparing self-reports and official records of arrests. Journal of Quantitative Criminology, 16, 87–110.
Michigan Public Policy Initiative. (2003). Zero tolerance policies and their impact on Michigan students. East Lansing, MI: Institute for Children, Youth, and Families.
Miller, N. (2004). Domestic violence: A review of state legislation defining police and prosecution duties and powers. Alexandria, VA: Institute for Law and Justice.
National Council on Crime and Delinquency. (2007). And justice for some: Differential treatment of youth of color in the juvenile justice system. Oakland, CA: Author.
Odem, M. E. (1995). Delinquent daughters: Protecting and policing adolescent female sexuality in the United States, 1885–1920. Chapel Hill, NC: University of North Carolina Press.
Office of juvenile Justice and Delinquency Prevention. (2009, May/June). Training aims to improve interactions between law enforcement and adolescent girls. OJJDP News. Retrieved from http://www.ncjrs.gov/html/ojjdp/news_at_glance/226641/sf_2.html
Park, S., Morash, M., & Stevens, T. (2010). Gender differences in predictors of assaultive behavior in late adolescence. Youth Violence and Juvenile Justice: An Interdisciplinary Journal, 8, 314–331.
Potter, H. (2006). An argument for black feminist criminology: Understanding African American women’s experience with intimate partner abuse using an integrated approach. Feminist Criminology, 1, 106–124.
Puzzanchera, C. (2009). Juvenile arrests, 2008. Washington, DC: Office of Juvenile Justice and Delinquency Prevention.
Puzzanchera, C., Adams, B., & Sickmund, M. (2010). Juvenile court statistics 2006–2007. Pittsburgh, PA: National Center for Juvenile Justice.
Puzzanchera, C., Stahl, A. L., Finnegan, T. A., Tierney, N., & Snyder, H. N. (2004). Juvenile court statistics 2000. Pittsburgh, PA: National Center for Juvenile Justice.
Raffaele Mendez, L. M., & Knoff, H. M. (2003). Who gets suspended from school and why: A demographic analysis of schools and disciplinary infractions in a large school district.Education and Treatment of Children, 26, 30–51.
Rao, J. N. K., & Scott, A. J. (1984). On chi-squared tests for multiway contingency tables with cell proportions estimated from survey data. Annals of Statistics, 12, 46–60.
Reynolds, C. R., Conoley, J., Garcia-Vazquez, E., Graham, S., Sheras, P., & Skiba, R. (2006). Are zero tolerance policies effective in the schools? An evidentiary review and recommendations. American Psychologist, 63, 852–862.
Rosenfeld, R. (2007). Explaining the divergence between UCR and NCVS aggravated assault trends. In J. P. Lynch & L. A. Addington (Eds.), Understanding crime statistics: Revisiting the divergence of the NCVS and UCR (pp. 251–268). New York: Cambridge University Press.
Schwartz, I. M. (1989). (In)justice for juveniles: Rethinking the best interests of the child. Lexington, MA.: Lexington Books.
Schwartz, J., Steffensmeier, D. J., & Feldmeyer, B. (2009). Assessing trends in women’s violence via data triangulation: Arrests, convictions, incarcerations, and victim reports. Social Problems, 56(3), 494–525.
Sherman, L. W. (1992). The influence of criminology on criminal law: Evaluating arrests for misdemeanor domestic violence. Journal of Criminal Law and Criminology, 83, 1–45.
Sickmund, M. (2003). Juveniles in court [Electronic Version]. Retrieved from http:// www.ncjrs.gov/html/ojjdp/195420/contents.html
Sickmund, M. (2009). Delinquency cases in juvenile court, 2005. Washington, DC: Office of Juvenile Justice and Delinquency Prevention.
Sickmund, M., Sladky, A., & Kang, W. (2008). Easy access to juvenile court statistics: 1985–2005 [Electronic Version]. Retrieved from http://ojjdp.ncjrs.gov/ojstatbb/ ezajcs/Skiba,
R. J., Michael, R. S., Nardo, A. C., & Peterson, R. (2002). The color of discipline: Sources of racial and gender disproportionality in school punishment. The Urban Review, 34, 317–342.
Skiba, R., & Peterson, R. (1999). The dark side of zero tolerance: Can punishment lead to safe schools? Phi Delta Kappan, 80, 372–376, 381–382.
Skiba, R., & Rausch, M. K. (2006). School disciplinary systems: Alternatives to suspension and expulsion. In G. G. Bear & K. M. Minke (Eds.), Children’s needs III: Understanding and addressing the developmental needs of children (pp. 87–102). Bethesda, MD: National Association of School Psychologists.
Snyder, H. N., & Sickmund, M. (2006). Juvenile offenders and victims: 2006 National report. Washington, DC: US Department of Justice, Office of Justice Programs, Office of Juvenile Justice and Delinquency Prevention.
Steffensmeier, D., Schwartz, J., Zhong, H., & Ackerman, J. (2005). An assessment of recent trends in girls’ violence using diverse longitudinal sources: Is the gender gap closing? Criminology, 43, 355–405.
Tailor, H., & Detch, E. R. (1998). Getting tough on kids: A look at zero tolerance. Nashville, TN: Tennessee Office of Education Accountability, Comptroller of the Treasury.
US Census Bureau. (1996). Historical annual time series of state population estimates and demographic components of change 1980 to 1990, by single year of age and sex. Washington, DC: Population Estimates Program, Population Division, US Census Bureau.
US Census Bureau. (2004). National estimates by demographic characteristics—Single year of age, sex, race, and Hispanic Origin. Washington, DC: Population Estimates Program, Population Division, US Census Bureau.
Verdugo, R. R. (2002). Race-ethnicity, social class, and zero-tolerance policies: The cultural and structural wars. Education and Urban Society, 35, 50–75.
Wallace, J. M., Goodkind, S., Wallace, C. M., & Bachman, J. G. (2008). Racial, ethnic, and gender differences in school discipline among US high school students: 1991–2005. Negro Educational Review, 59(1-2), 47–62.
Wilson, J. Q., & Kelling, G. L. (1982). Broken windows: The police and neighborhood safety. The Atlantic Monthly, 249, 29–36, 38.